2/2/2016
Topic:
How to use the Rubicon Histogram Tool
Philip van der WelAdministrator
|
The Rubicon Histogram Tool is a quick and effective way to graphically show the distribution of your data, allowing you to generate a histogram plot and descriptive statistics with minimal effort.
When preparing a pavement or rehabilitation design report you may want to analyse a population of data, such as the rut depth distribution, on a section of road. Whilst strip maps and scatter plots are helpful, a histogram together with descriptive statistics is a better option for concisely summarizing the distribution of data.
Histogram plots and statistics can be prepared in Excel, however the calculations and graph formatting all take time.
Getting Started
The Histogram Tool is accessed through the Reporting Tools icon on the Rubicon Toolbox Online Tools.

Click on the Reporting Tools icon and select Histogram Plot from the list. A Histogram Plot Report page will open.
To start, download the Example Template, enter the relevant data and save the template.

Note, when entering your data in the Excel template, ensure you set up a data range and a bin range, so that there are no erroneous empty cells (the ranges will be read until an empty cell is encountered). Take note of the upper-left cell (anchor cell) of each range (highlighted below).

Running the Analysis
Once you have completed the template, proceed with the following steps to complete the analysis.


The report can be copied to the clipboard by right clicking on the report and selecting Copy image or Save image as. The image can then be inserted into a document of your choice (Word, Excel etc.).
Since the template is saved on your PC, the analysis is not saved online. The analysis can be repeated, as and when required.
edited by on 5/22/2021
edited by on 2/17/2023
edited by on 10/19/2023 |
2/2/2016
Topic:
Introduction to the Rubicon Histogram Tool
Philip van der WelAdministrator
|
When preparing a pavement or rehabilitation design report you may want to analyse a population of data, such as the rut depth distribution, on a section of road. Whilst strip maps and scatter plots are helpful, a histogram together with descriptive statistics is a better option for concisely summarizing the distribution of data.
Histogram plots and statistics can be prepared in Excel, however the calculations and graph formatting all take time. The Rubicon Toolbox Histogram tool allows you to quickly generate a histogram plot and descriptive statistics with minimal effort. See How to use the Rubicon Toolbox Histogram Tool for detailed instructions.

edited by on 11/20/2020
edited by on 12/9/2020
edited by on 2/17/2023 |
11/18/2016
Topic:
Rubicon Toolbox Backup Strategy
Philip van der WelAdministrator
|
We ensure every possible measure is taken to protect and secure our users' data in case of an unforeseen event or user error. Our backup strategy and recovery process ensure minimal loss of data and include the following steps:
- Once every week a full backup of all SQL Server databases is made (including all user-uploaded files); and
- Once every three hours a differential backup of all SQL Server databases is made. A differential backup is a cumulative backup of all changes made since the last full backup.
- The combination of the points above ensure that in a worst case scenario data loss is limited to changes made in the past three hours.
- A copy of the backups are left on the server and cleared every 30 days.
- Immediately following each backup (full and differential), a copy of the backup file is compressed and saved on a different cloud server and encrypted with a password.
Please contact Rubicon Support if you have any questions regarding data security. |
11/29/2016
Topic:
Introduction to the Rubicon Stripmap Tool
Philip van der WelAdministrator
|
The Stripmap tool is a very useful Rubicon Toolbox feature, giving you the ability to display project data in a series of highly customisable strips.
There are five types of strips available:
1. Bar
2. Scatter Plot
3. Block
4. Text
5. Ruler
The image below is an example of a typical Stripmap, showing the rutting, roughness, and pavement defects in both directions, as well as planned treatments for the area and a location strip.
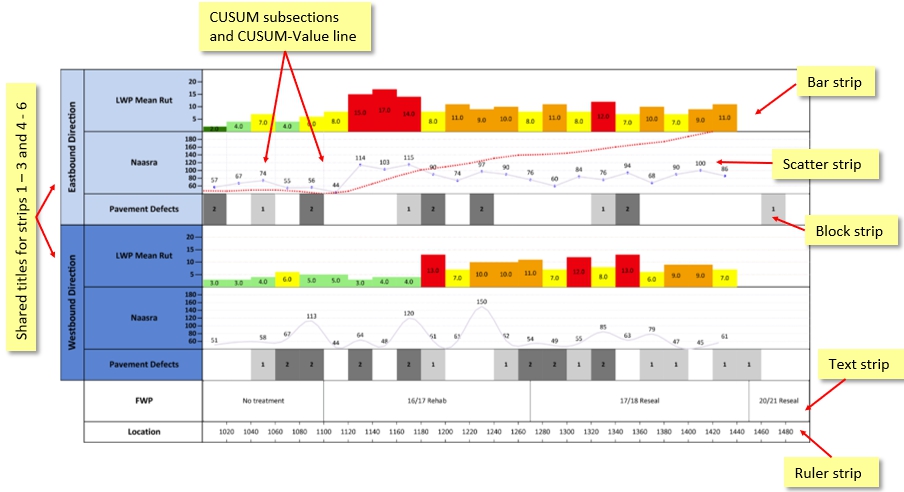
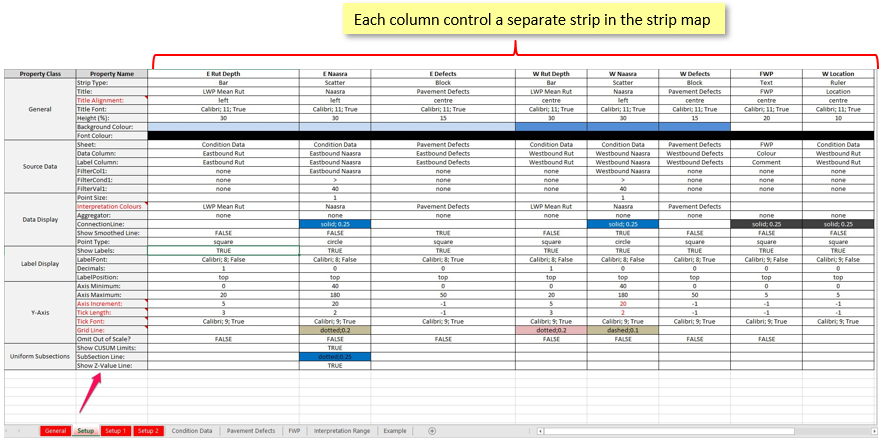
The Stripmap is run by an Excel template with a number of mandatory worksheets – General, Setup and Interpretation Range – as well as other worksheets containing the project data displayed in the strips. (The example above is controlled by the following sheets.)
The worksheet titled Setup is where the strips are set up, one column for each strip. Click here to see a separate Help Post containing further information on the Setup sheet.
The General sheet controls the Locations, Shared Titles and Vertical lines.
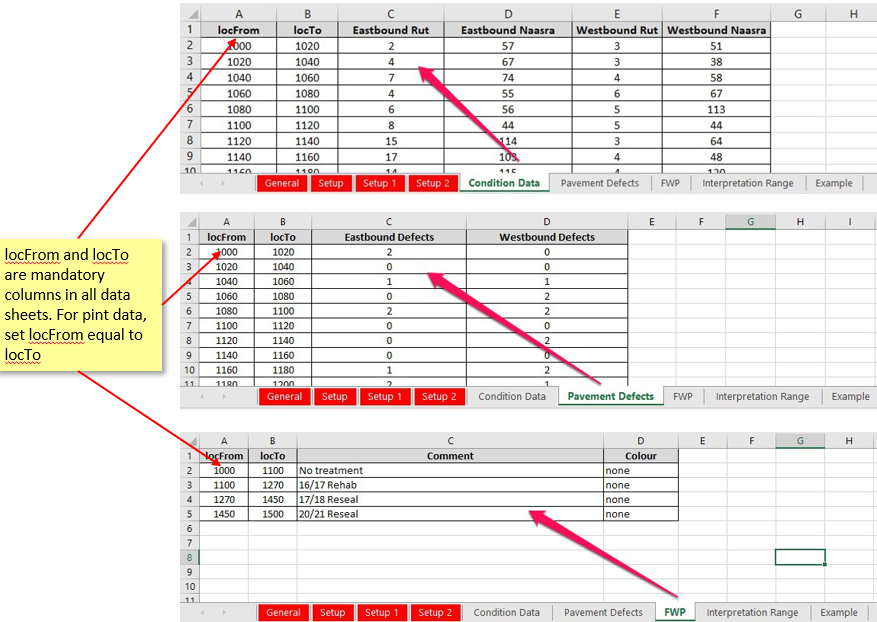
Data to populate the strips can be stored in as many or as few worksheets as required. Each sheet must contain locFrom and locTo columns in the first two columns, and only have one row of headings. For the example shown below, the data is separated into three sheets: Condition Data (for rutting and roughness), Pavement Defects, and FWP. Data sheets can be named by the user.
locFrom and locTo are mandatory columns in all data sheets, and must be in Columns A and B. For point data, set locFrom equal to locTo.
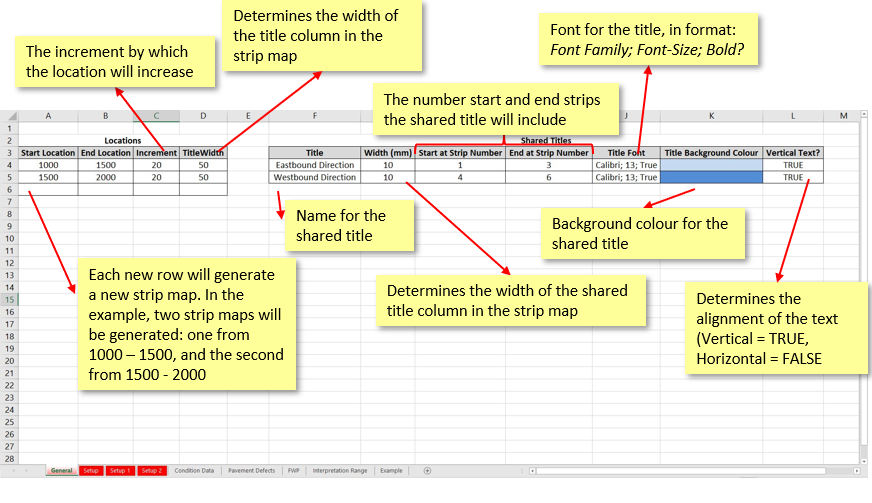
As well as setting up each strip in the Setup sheet, information on the location of the Stripmap and the optional shared titles is required in the Locations and Shared Titles worksheets. The images below contain details for each:
Data to populate the strips can be stored in as many or as few worksheets as required, however each must contain a locFrom and locTo column. For this example, the data is separated into three sheets: Condition Data (for rutting and roughness), Pavement Defects, and FWP.
An overview of the Setup worksheet can be found here, and detailed instructions for each strip type are available at the links below:
edited by philip@lonrix.com on 12/2/2016
edited by danielle.turner@lonrix.com on 12/14/2017
edited by tpotgieter on 1/24/2020
edited by on 4/15/2020
edited by on 11/23/2020
edited by on 6/1/2021
edited by on 2/15/2022
edited by on 2/15/2022
edited by on 10/31/2023
edited by on 11/24/2023 |
12/2/2016
Topic:
How to setup a Scatter Plot Strip
Philip van der WelAdministrator
|
The Scatter Strip is one of five strip types available in the Rubicon Stripmap tool. The image below is an example of a typical scatter strip:
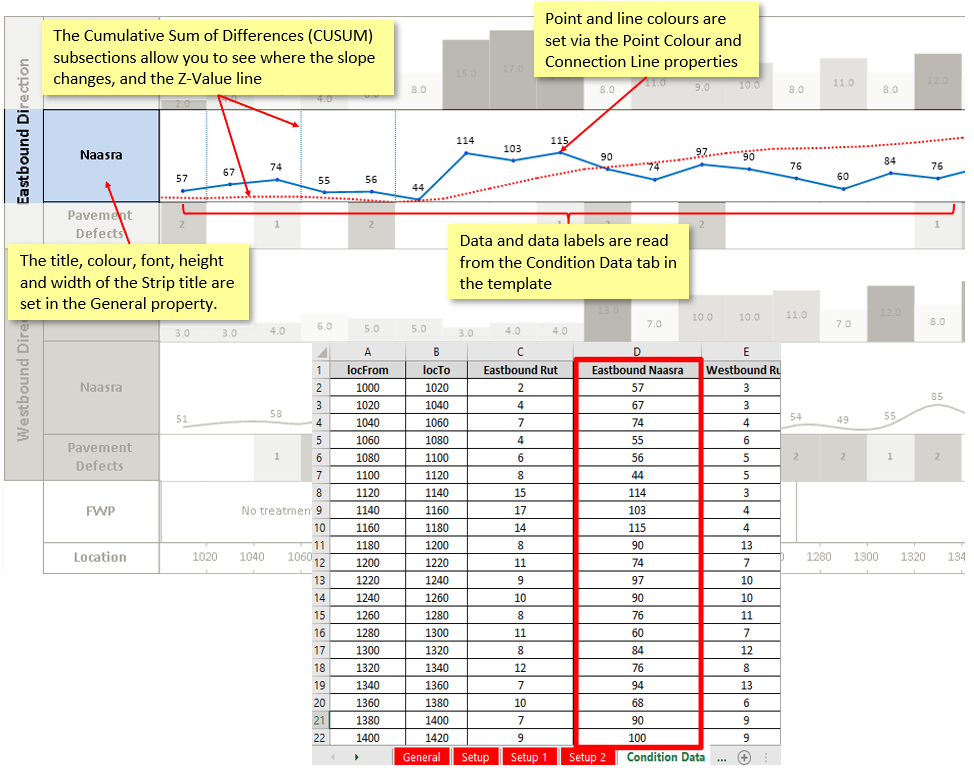
Each strip in your stripmap is setup in the Setup worksheet of your Excel template. Click here for an overview of the Setup worksheet.
The scatter strip in the example above is controlled by the following setup. The explanations (in italics) describe the function of each property with regards to the scatter strip.
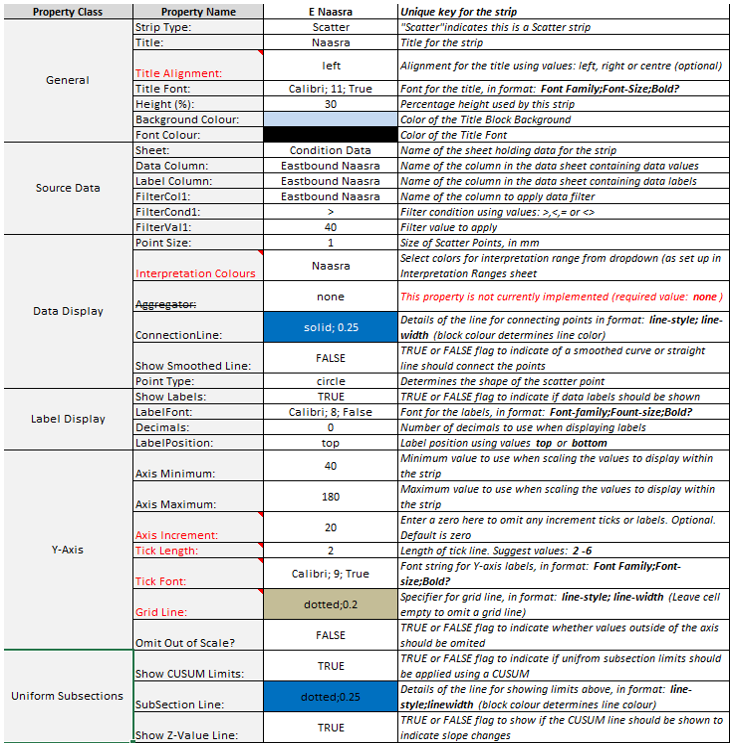
Detailed instructions for the remaining strip types are available at the links below:
edited by philip@lonrix.com on 1/9/2017
edited by danielle.turner@lonrix.com on 12/14/2017
edited by danielle.turner@lonrix.com on 12/14/2017
edited by danielle.turner@lonrix.com on 12/14/2017
edited by danielle.turner@lonrix.com on 12/14/2017
edited by on 2/5/2020
edited by on 11/20/2020
edited by on 2/15/2022
edited by on 2/15/2022
edited by on 2/15/2022
edited by on 10/24/2023
edited by on 10/24/2023 |
12/2/2016
Topic:
How to setup a Block Strip
Philip van der WelAdministrator
|
The Block Strip is one of five strip types available in the Rubicon Stripmap tool. The image below is an example of a typical block strip:
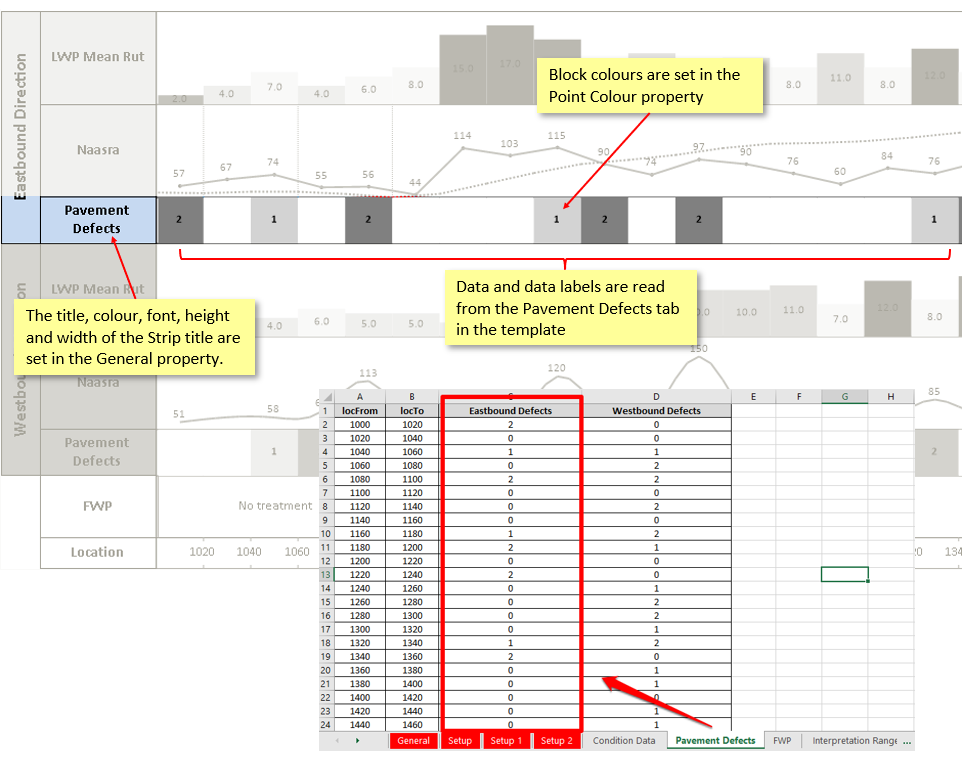
Each strip in your stripmap is setup in the Setup worksheet of your Excel template. Click here for an overview of the Setup worksheet.
The block strip in the example above is controlled by the following setup. The explanations (in italics) describe the function of each property with regards to the block strip.
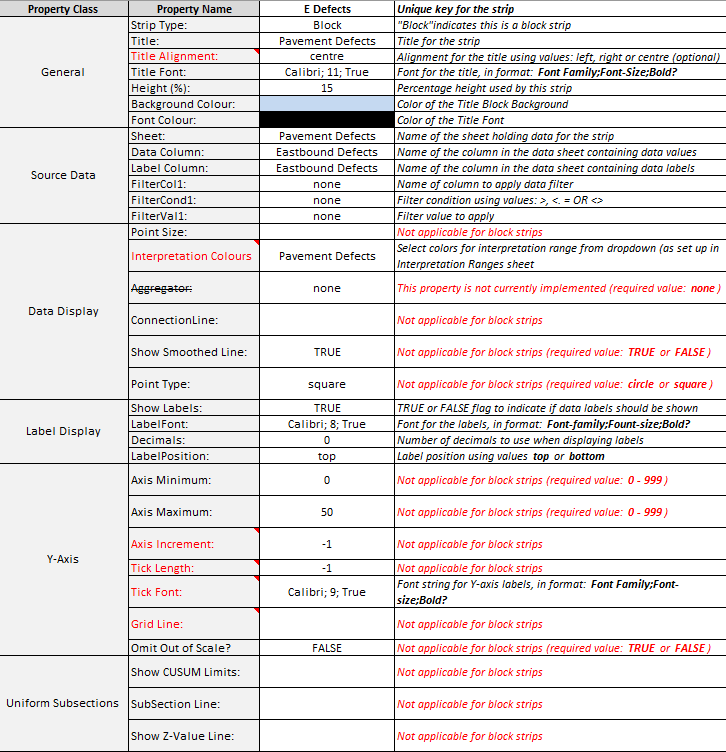
Detailed instructions for the remaining strip types are available at the links below:
edited by philip@lonrix.com on 1/9/2017
edited by danielle.turner@lonrix.com on 12/14/2017
edited by danielle.turner@lonrix.com on 12/14/2017
edited by on 2/5/2020
edited by on 11/20/2020
edited by on 2/15/2022
edited by on 2/15/2022
edited by on 10/24/2023 |
12/2/2016
Topic:
How to setup a Text Strip
Philip van der WelAdministrator
|
The Text Strip is one of five strip types available in the Rubicon Stripmap tool. The image below is an example of a typical text strip:
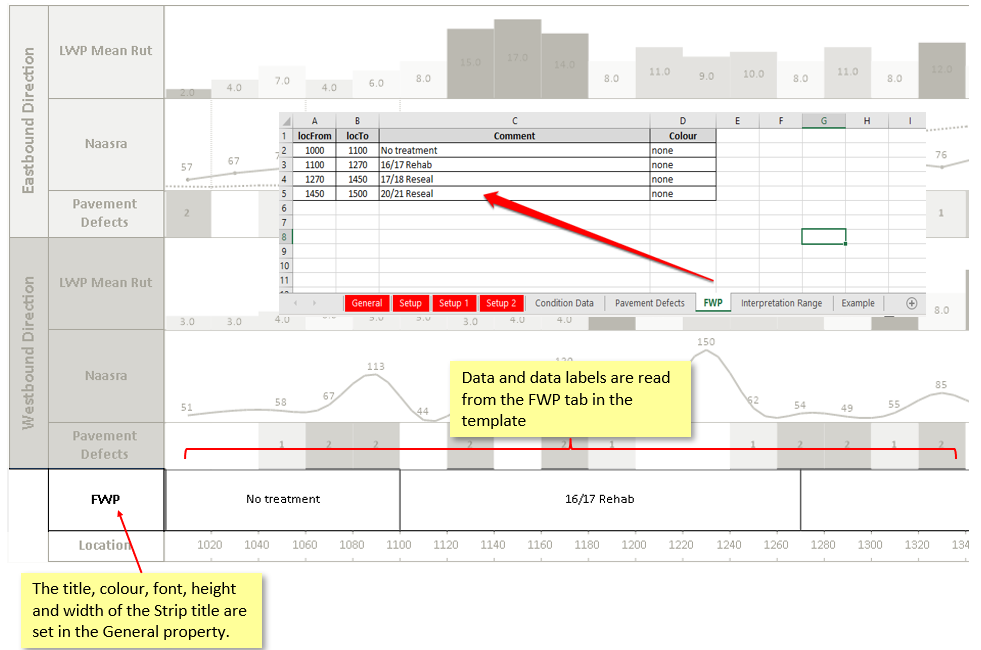
Each strip in your stripmap is setup in the Setup worksheet of your Excel template. Click here for an overview of the Setup worksheet.
The text strip in the example above is controlled by the following setup. The explanations (in italics) describe the function of each property with regards to the text strip.
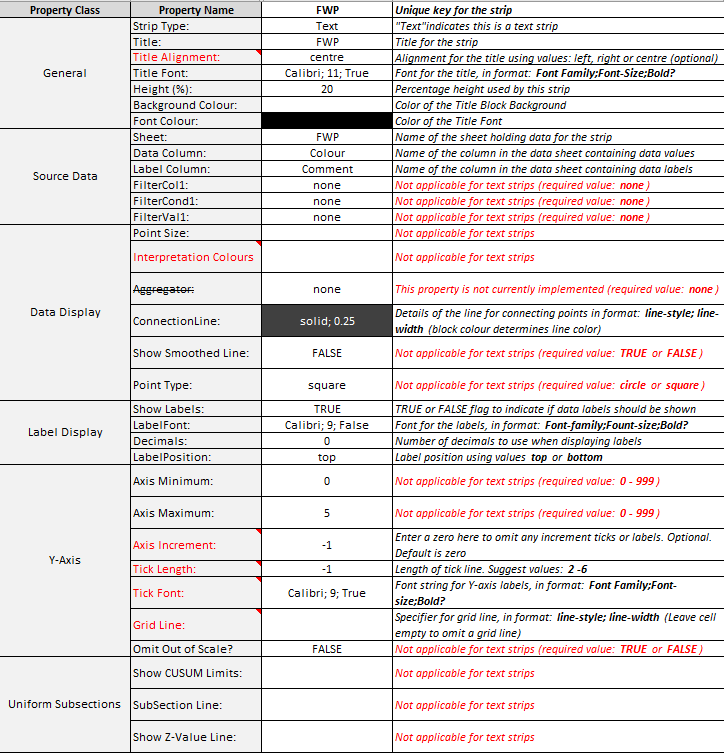
Detailed instructions for the remaining strip types are available at the links below:
edited by philip@lonrix.com on 1/9/2017
edited by danielle.turner@lonrix.com on 12/14/2017
edited by on 2/5/2020
edited by on 2/5/2020
edited by on 11/20/2020
edited by on 2/15/2022
edited by on 10/24/2023 |
12/2/2016
Topic:
How to setup a Ruler Strip
Philip van der WelAdministrator
|
The Ruler Strip is one of five strip types available in the Rubicon Stripmap tool. The image below is an example of a typical ruler strip:
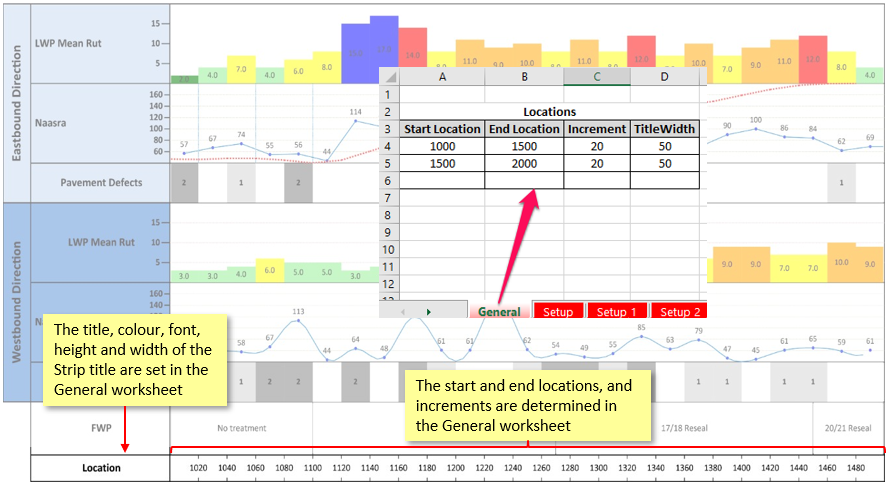
Each strip in your stripmap is setup in the Setup worksheet of your Excel template. Click here for an overview of the Setup worksheet.
The ruler strip in the example above is controlled by the following setup. The explanations (in italics) describe the function of each property with regards to the ruler strip.
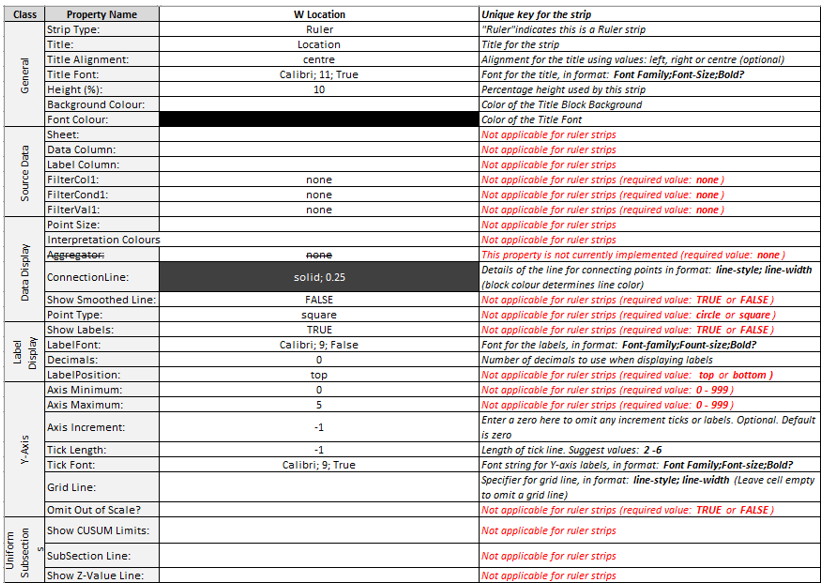
Detailed instructions for the remaining strip types are available at the links below:
edited by philip@lonrix.com on 1/9/2017
edited by danielle.turner@lonrix.com on 12/14/2017
edited by tpotgieter on 1/24/2020
edited by tpotgieter on 1/24/2020
edited by tpotgieter on 1/24/2020
edited by tpotgieter on 1/24/2020
edited by on 4/1/2020
edited by on 11/20/2020
edited by on 2/15/2022
edited by on 2/15/2022
edited by on 10/24/2023
edited by on 10/24/2023 |
12/2/2016
Topic:
How to setup a strip
Philip van der WelAdministrator
|
The Rubicon Stripmap Tool is run by a Excel template with a number of mandatory worksheets - Setup, Location, and Shared Titles (as well as other worksheets containing the project data displayed in the strips). For an overview of the various worksheets, refer to the Introduction to the Rubicon Stripmap Tool.
The Setup worksheet is where the majority of the strip set up is carried out. Each of the five strip types require slightly different inputs, however there are a number of commonalities between them.
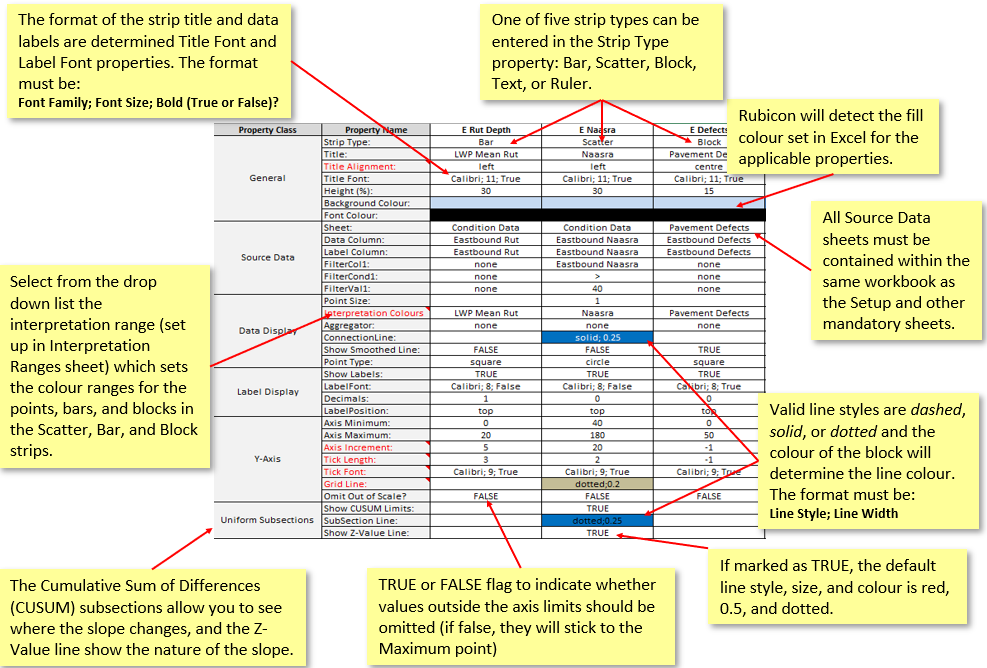
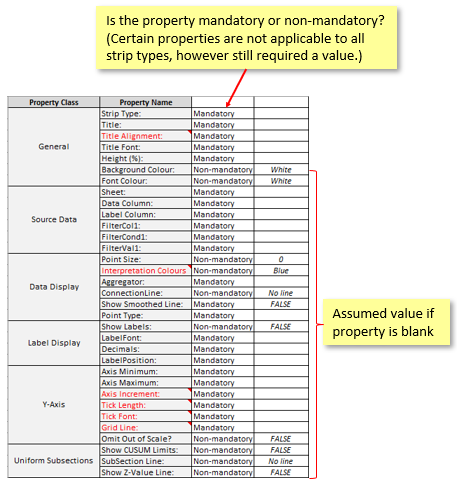
While the majority of properties are mandatory (regardless of whether they are applicable to the strip type in question), a few can be left blank with the values noted below assumed if this is the case.
Further details relating to each strip type can be found in separate help posts, linked below:
edited by philip@lonrix.com on 1/9/2017
edited by danielle.turner@lonrix.com on 12/14/2017
edited by on 2/5/2020
edited by on 3/31/2020
edited by on 4/1/2020
edited by on 11/20/2020
edited by on 2/15/2022
edited by on 2/15/2022
edited by on 10/24/2023 |
12/2/2016
Topic:
How to setup a Bar Graph Strip
Philip van der WelAdministrator
|
The Bar Strip is one of five strip types available in the Rubicon Stripmap tool. The image below is an example of a typical bar strip:
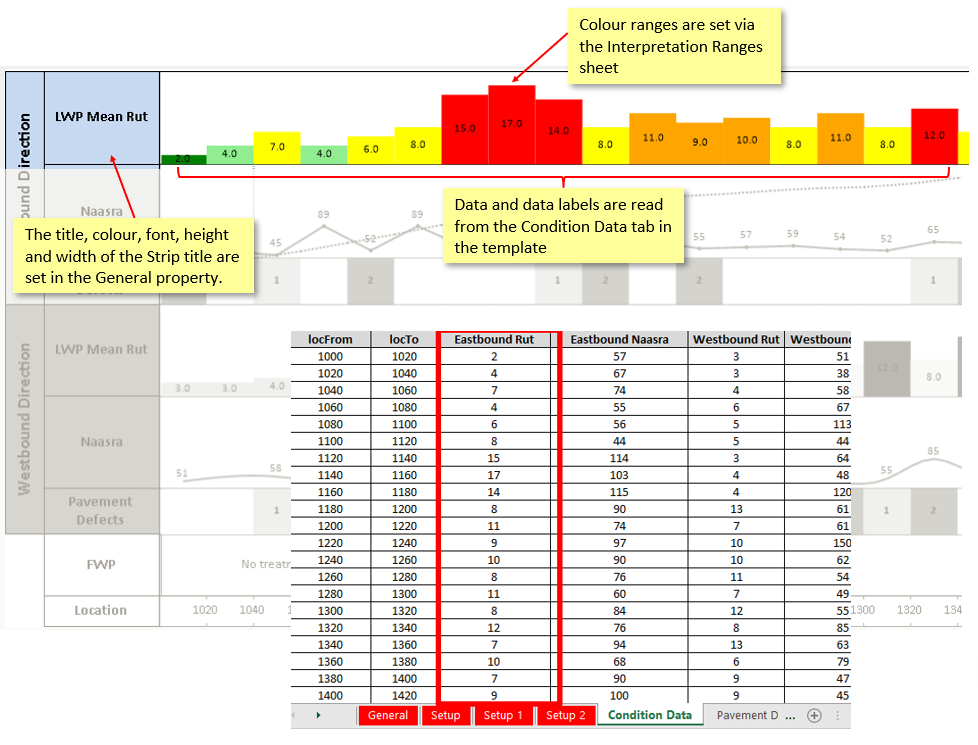
Each strip in your stripmap is setup in the Setup worksheet of your Excel template. Click here for an overview of the Setup worksheet.
The bar strip in the example above is controlled by the following setup. The explanations (in italics) describe the function of each property with regards to the Bar strip.
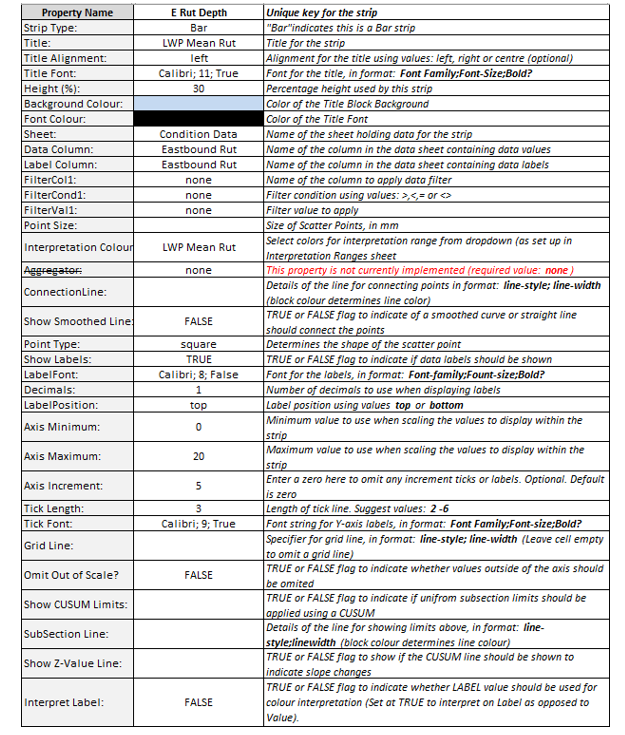
Detailed instructions for the remaining strip types are available at the links below:
edited by philip@lonrix.com on 1/9/2017
edited by danielle.turner@lonrix.com on 12/14/2017
edited by on 2/5/2020
edited by on 4/15/2020
edited by on 11/20/2020
edited by on 2/15/2022
edited by on 2/15/2022
edited by on 10/24/2023
edited by on 10/24/2023 |